


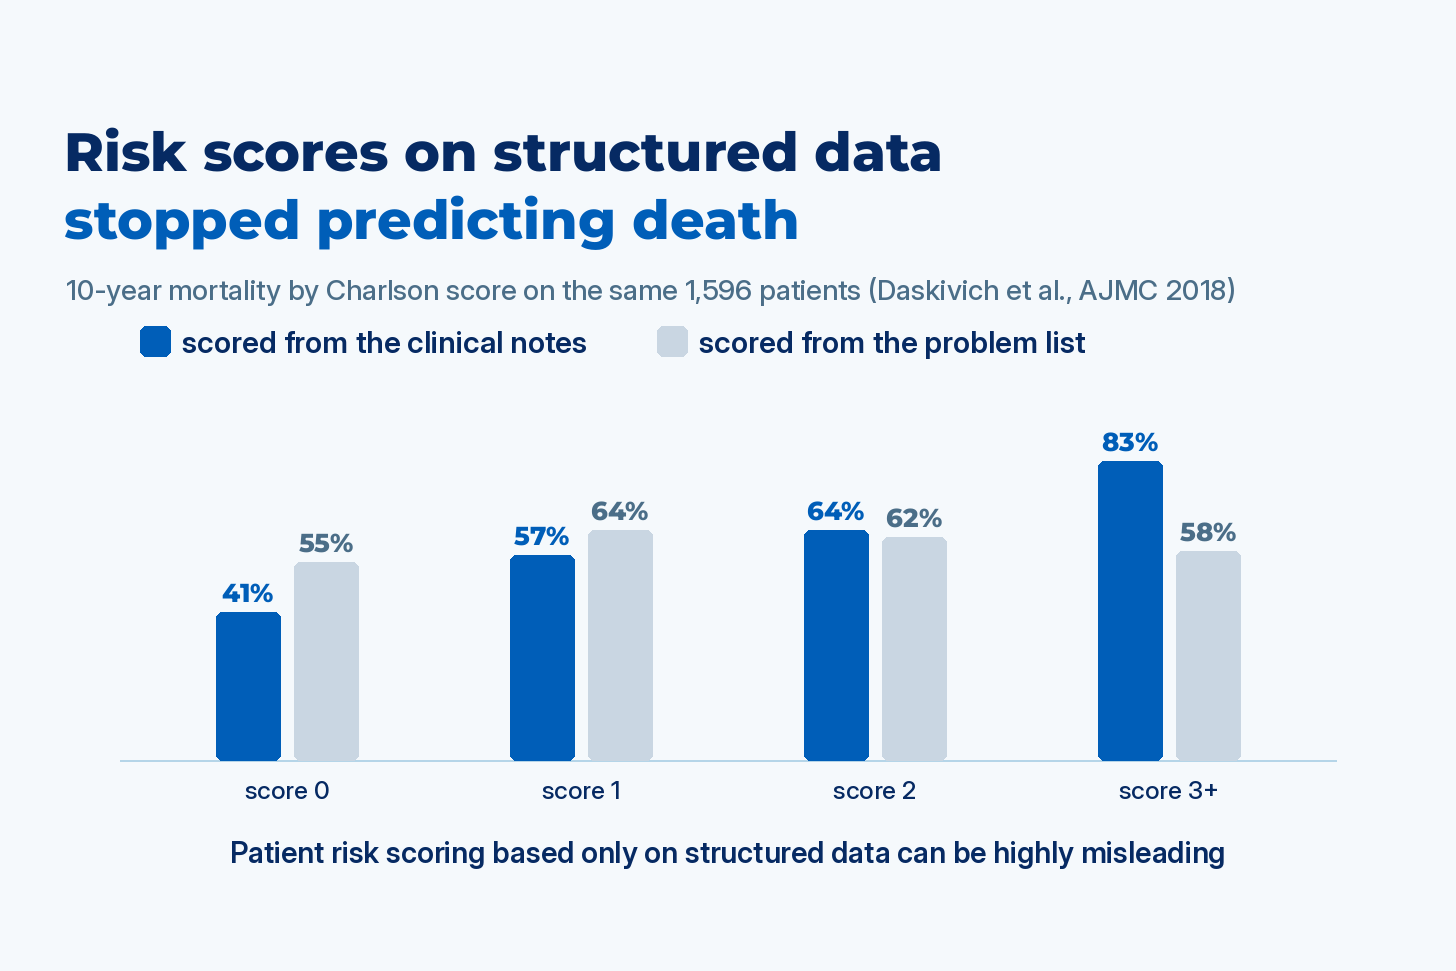
In a ten-year study of 1,596 veterans, the standard comorbidity score predicted who would die when it was computed from clinicians’ notes, and predicted nothing when it was computed from the diagnoses on the problem list (Daskivich et al., American Journal of Managed Care, 2018). Two more recent studies, from Finland and from 200 US hospitals, find the same failure in a mortality model and in hospital rankings.
Comparing one hospital with another, or paying a health plan for the patients it covers, starts with an estimate of how sick the patients were to begin with. That estimate is called risk adjustment, and it’s computed from structured data: the diagnosis codes on insurance claims and the problem list (the running list of a patient’s diagnoses in the electronic health record, or EHR). It decides which hospitals are flagged for high mortality and how much Medicare pays a plan for each member, and the notes clinicians write aren’t part of it. My team at John Snow Labs builds pipelines that compute these scores from the full record, and this post collects the published evidence plus a test you can run on your own score.
Three common risk scores that start from diagnosis codes
A hospital that treats older, sicker patients will have more deaths than one that treats healthy ones, so every fair comparison first turns each patient’s list of diagnoses into a number:
Charlson. The Charlson Comorbidity Index, published in 1987, gives points for 19 conditions (1 for heart failure, COPD or diabetes, 2 for kidney disease or cancer, 3 for severe liver disease, 6 for metastatic cancer or AIDS) and adds them up to predict the chance of dying.
CMS-HCC. Medicare’s CMS-HCC risk model maps diagnosis codes to condition categories, and each category raises a member’s risk score. The score sets the monthly payment a Medicare Advantage plan receives and the spending benchmark an accountable care organization (ACO), a group of providers paid for keeping costs down, is measured against.
Elixhauser. A close cousin used in hospital outcomes research.
If a condition isn’t coded on a claim or the problem list, then as far as these scores are concerned, the patient doesn’t have it. My September post on structured data showed how much that misses: almost 40% of documented diagnoses in one London hospital were missing from the problem list, codes recorded about a third of measured obesity, and 3% of documented suicidal ideation got a code. The studies below compute the same score twice on the same patients, from codes and from the full chart, and check which version predicts the outcome.
Charlson scores from the problem list predicted nothing in 1,596 veterans
Daskivich and colleagues took 1,596 men diagnosed with prostate cancer at two Southern California VA medical centers between 1998 and 2004, followed them for ten years, and computed each man’s Charlson score two ways: from the problem list, and from a manual reading of the notes. Against the notes, the problem list recorded:
8% of heart attacks and 23% of heart failure
31% of peripheral vascular disease and 32% of strokes
42% of COPD and 46% of diabetes
1% of liver disease
When the problem list did record a condition, it was almost always right (specificity above 94%, meaning few patients were coded for something they didn’t have). The average Charlson score was 1.1 from the notes and 0.5 from the problem list.
Then the authors checked whether a higher score predicted a higher chance of dying from causes other than prostate cancer. From the notes, it did: ten-year mortality was 41%, 57%, 64% and 83% for scores of 0, 1, 2, and 3 or more. From the problem list, the same index predicted nothing: 55%, 64%, 62% and 58%. Taken at face value, the coded version says a man with heart failure, COPD and dementia is no more likely to die in the next decade than a man with none of them.
The authors concluded that problem list data should be validated before they’re used for risk adjustment, and noted that the outpatient claims used for risk adjustment are closely linked with the problem list.
Diagnosis codes made a twofold death risk look protective
The most recent version of that finding comes from Finland, with a language model doing the reading instead of a physician. Falls and incontinence are two classic warning signs of frailty in older adults, and nurses, therapists and home care workers mostly record them in notes. A 2025 study in the Computational and Structural Biotechnology Journal ran a Finnish BERT model, trained to find mentions of these conditions in text, over 10.6 million free-text entries for 102,525 patients aged 50 to 80. The records covered primary, hospital, long-term and home care in Central Finland from 2010 to 2022, and the authors compared what the model found with the ICD-10 diagnosis codes for the same patients:
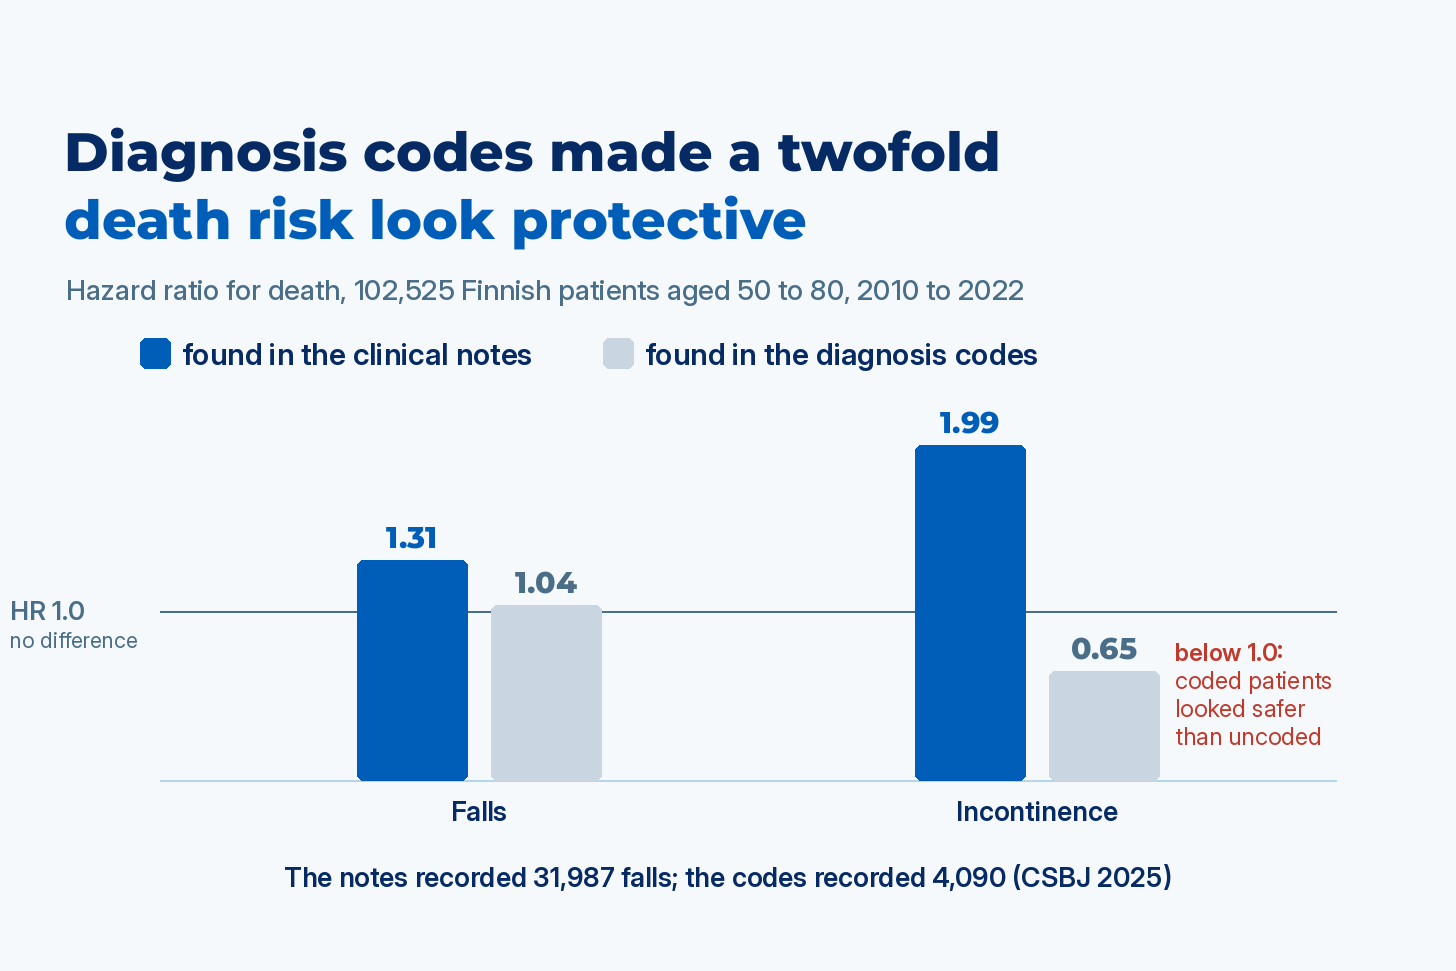
Falls: 31,987 onsets in the notes, against 4,090 in the codes.
Incontinence: 7,059 onsets in the notes, against 3,873 in the codes, and only 30% of the coded onsets matched one found in the notes.
Then the authors used each version to predict death from any cause, reported as a hazard ratio (the death rate of patients with the condition relative to patients without it, where 1.0 means no difference). Falls found in the notes had a hazard ratio of 1.31; falls found in the codes had 1.04, with no statistically significant link to death. Incontinence found in the notes had a hazard ratio of 1.99, so those patients died at twice the rate. Incontinence found in the codes had a hazard ratio of 0.65, as if the condition protected against death. The authors traced it to the coded group itself: 78% of patients with code-defined incontinence were still alive at the end of follow-up. A frailty program that picked patients by that code would have put its most vulnerable patients last.
Sepsis rankings changed for 21 of the 50 worst-ranked hospitals
Hospitals are compared on sepsis mortality, starting from codes that say which patients had sepsis and how sick they were. Rhee and colleagues in Critical Care Medicine in 2019 tested that step across 4.3 million adult encounters at 193 US hospitals, identifying sepsis a second way, from clinical evidence in the EHR: blood cultures, antibiotics, vasopressors (drugs that raise blood pressure) and lab results. A typical hospital’s claims caught 30% of its sepsis cases, and the range across hospitals ran from 5% to 54%. Because the gap differs by hospital, it doesn’t cancel out: among the hospitals that looked best on sepsis mortality by claims, 46% moved to worse quartiles with the clinical data.
The same group then re-ranked 200 hospitals on sepsis mortality in Open Forum Infectious Diseases in 2020, across 4.0 million hospitalizations. They sorted the hospitals into four groups from best to worst twice: first with a risk model built on demographics, comorbidity codes and severity-of-illness codes, then with a model that replaced the severity codes with lab results, vasopressors and mechanical ventilation.
21 of the 50 hospitals in the worst group under the code-based model (42%) moved to a better group under the clinical one.
14 of the 50 in the best group (28%) moved to a worse one.
Agreement between the two rankings was moderate, a weighted kappa of 0.55 on a scale where 1.0 is identical rankings.
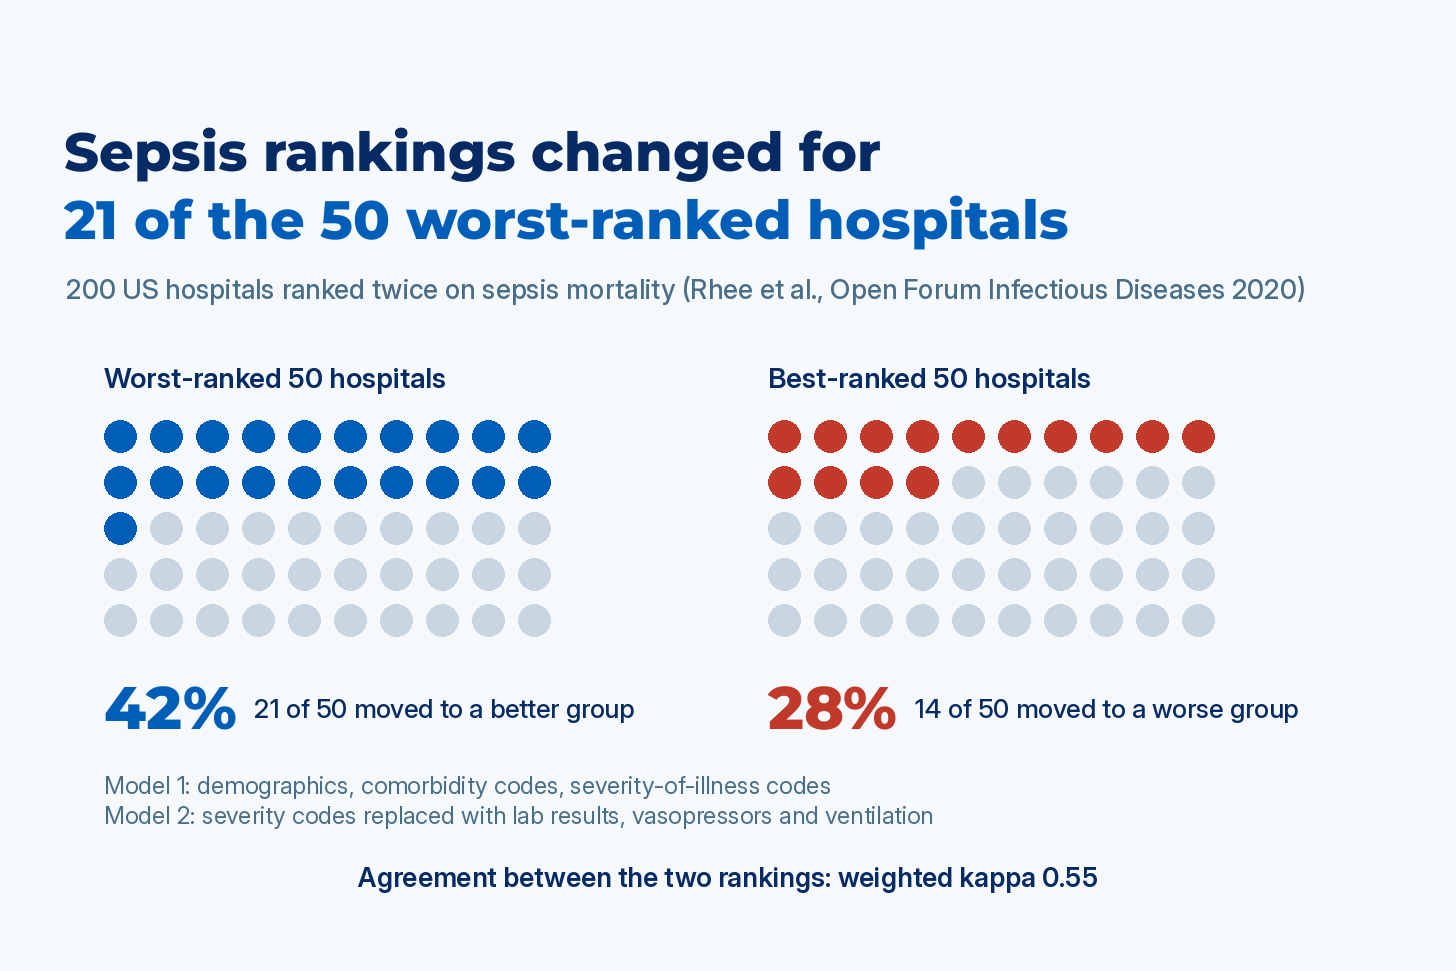
The clinical data here are structured lab and medication records, so this study shows what happens when a ranking stops relying on codes alone: a hospital’s sepsis grade depended on which data the risk model was given.
Medicare dementia codes missed 23% of cases and 34% were wrong
These scores also set payments. In 2020, Medicare added Alzheimer’s disease and related dementias back into the CMS-HCC model for Medicare Advantage and ACO payments, so that plans are funded for the extra care those patients need. In Health Affairs in 2022, Festa and colleagues checked the claims-based dementia category against the chart in a large ACO, using 2016 to 2018 data and clinicians to decide which beneficiaries had dementia:
An estimated 7.5% of beneficiaries had dementia, and 22.7% of them had no dementia code. Medicare spending on those uncoded patients was $14,619 per beneficiary higher than on correctly coded ones, and under the 2020 model their dementia would add nothing to the payment.
In the other direction, 34% of beneficiaries with the dementia code didn’t have the disease on clinical review.
A companion analysis in JAMA Health Forum found that when the dementia code appeared only on hospital claims, more than two thirds of those patients didn’t have dementia, and the code did no better than chance at telling who did.
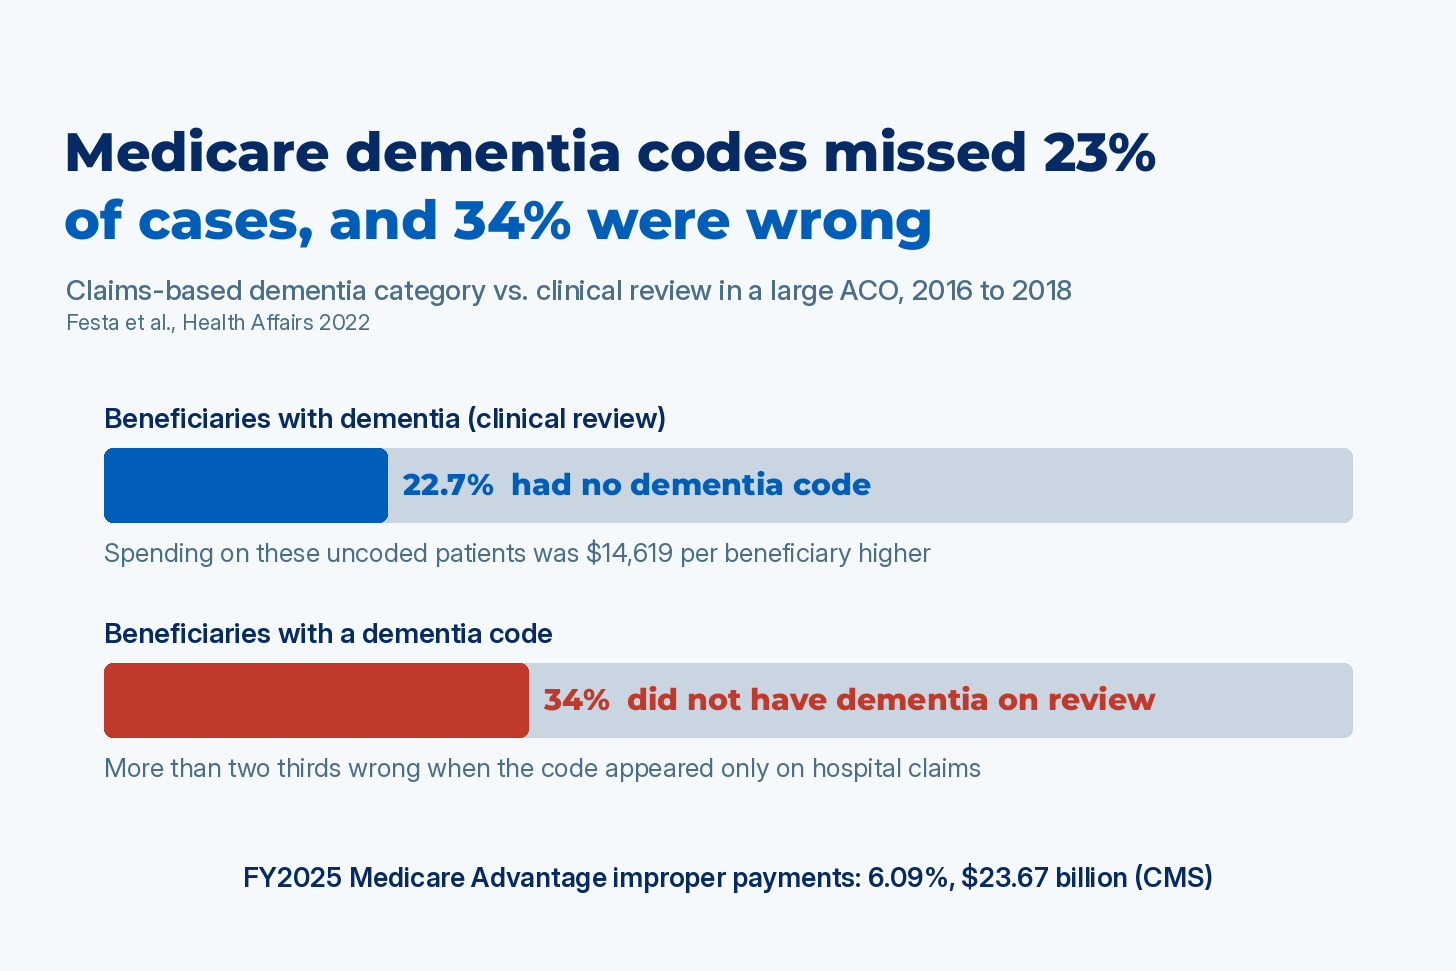
The second direction is what CMS audits. In a Risk Adjustment Data Validation (RADV) audit, CMS pulls the medical record behind a sample of the diagnoses a plan submitted. CMS’s fiscal year 2025 improper payments report put Medicare Advantage (Part C) improper payments at 6.09%, or $23.67 billion, mostly from cases where the plan’s documentation failed to support the diagnosis it submitted. A risk adjustment program that reads only codes can’t defend its numbers in either direction: it submits diagnoses the notes don’t support, and it leaves out diagnoses the notes do. I covered the audit side in June, in a post on the 2026 Medicare Advantage rate decision and HCC coding accuracy.
Three ways incomplete but accurate codes break a score
In the VA and sepsis studies, a code that’s present is almost always right (specificity above 94% in the VA data), while sensitivity, the share of actual cases that get a code, ranges from 1% to 54%. That sounds conservative, but inside a risk score it breaks the measure in three ways:
The missed patients aren’t missed at random. The coded patients tend to be the ones treated or billed for the condition, and the uncoded majority is scored as having none. In the VA study, men with a problem list score of 0 had 55% ten-year mortality, against 41% for men with a score of 0 from the notes: the “healthy” group was full of people who weren’t. That flattens the gradient, and when the coded group is unusual enough, as with incontinence in Finland, it reverses it.
The gap is different at every institution. Rhee’s 193 hospitals coded sepsis with anywhere from 5% to 54% sensitivity. When the error varies tenfold, hospitals move up and down the ranking for reasons unrelated to their care.
The gap changes over time. Rhee and colleagues in JAMA in 2017 found sepsis incidence by claims rising 10.3% a year from 2009 to 2014 at 409 hospitals, while incidence by clinical criteria was flat (+0.6% a year). Coding drift then looks like a change in outcomes.
Recalibrating the weights doesn’t repair any of this, because they’re fit to an input that has already put patients in the wrong groups.
Three checks before trusting a score built on diagnosis codes
Daskivich’s advice, to validate the data against outcomes first, comes down to three checks on your own data:
Does the score sort the outcome? In your own population, a higher score should predict a worse outcome at every step, instead of flattening the way the VA problem list score did.
How much does coding miss, and where? Measure what share of each condition your codes catch against a chart-reviewed sample, and whether that share differs across the sites or clinicians you compare.
Do the results move? Recompute the score from the full chart for one year of patients, with the extraction checked against a reviewed sample, and plot the outcome against both versions. See whether rankings, benchmarks or payments change.
If the code-based curve is flat or reversed where the full-chart one isn’t, the adjustment you’ve been applying isn’t adjusting for how sick your patients are. If rankings move, the units at the bottom of the list may be the ones that coded least, whatever the quality of their care.
Four requirements for a risk score from the full chart
Computing the score from codes and notes together, at production scale, takes four things:
Accurate extraction. Conditions extracted from notes and reports at regulatory-grade accuracy, validated against notes annotated by clinicians, so that “denies,” “family history of” and “history of, resolved” aren’t counted as active conditions.
Evidence for every condition. A link from each extracted fact to its source sentence, plus a confidence score, so an auditor can see the evidence and a low-confidence finding goes to a person before it’s counted.
Fixed scoring logic. The same chart produces the same score a year later.
A coder decides. Where the score sets payment, a certified coder decides what is submitted.
John Snow Labs’ HCC coding and clinical measure pipelines are built this way, with an evidence link attached to every condition they find. If you run the test on your own score and want to compare results, the comments are open.
Frequently asked questions
Isn’t a code list that’s rarely wrong good enough for risk adjustment?
No. It flags patients who mostly have the condition, while most patients with the condition are scored as healthy. That shrinks the gap between the two groups, which is why the VA problem list score showed 55% mortality in its “no comorbidity” group and coded incontinence in Finland had a hazard ratio below 1.
Can I fix this by recalibrating the model on my own coded data?
Recalibration refits the weights to the same misclassified input, so patients stay in the wrong group, and coding gaps that differ across hospitals and change over time remain. CMS-HCC’s coefficients are estimated from fee-for-service Medicare claims, so a typical level of undercoding is priced in on average. The Festa study shows the specific patients who were missed cost $14,619 more than those who were coded.
What does this mean for RADV audits and Medicare Advantage risk adjustment?
In a RADV audit, the medical record is the standard each submitted diagnosis is judged against. Reading the full chart finds documented conditions that were never coded and flags coded ones the documentation doesn’t support, with a certified coder reviewing every submission. This describes how the audit process works and isn’t legal advice; plans should rely on their own compliance counsel for what the rules require of them.
Do structured lab and vital sign data fix this without reading the notes?
Partly. Replacing severity codes with lab results, vasopressors and ventilation moved 42% of the worst-ranked sepsis hospitals, with no notes involved. Comorbidities, the input to Charlson, Elixhauser and CMS-HCC, are mostly documented in narrative, which is why the VA and Finnish studies had to read the notes.
Which conditions do codes miss most often?
In the VA study, the problem list recorded 1% of liver disease, 8% of heart attacks and 23% of heart failure documented in the notes. In Finland, codes recorded about one in eight falls found in the notes, and US hospital claims caught a median 30% of sepsis cases identified from clinical data.
I’m CEO of John Snow Labs, which builds the HCC coding and clinical measure pipelines described in this post.
A hazard ratio of 0.65 for incontinence is the kind of number that should fail a pipeline check before anyone reads it as medicine. Comparing each coded condition's prevalence against a small sample of notes, per site, catches this early, and it also shows which hospitals look healthier only because they code less.
In the VA study, how old were the heart attacks documented only in the notes? The medical history in notes often predates the earliest available diagnose codes. Also, is it possible that coded heart attacks were missing because heart attacks were treated in emergency care at the closest hospital, while the VA records primarily reflected scheduled visits and care for chronic conditions.